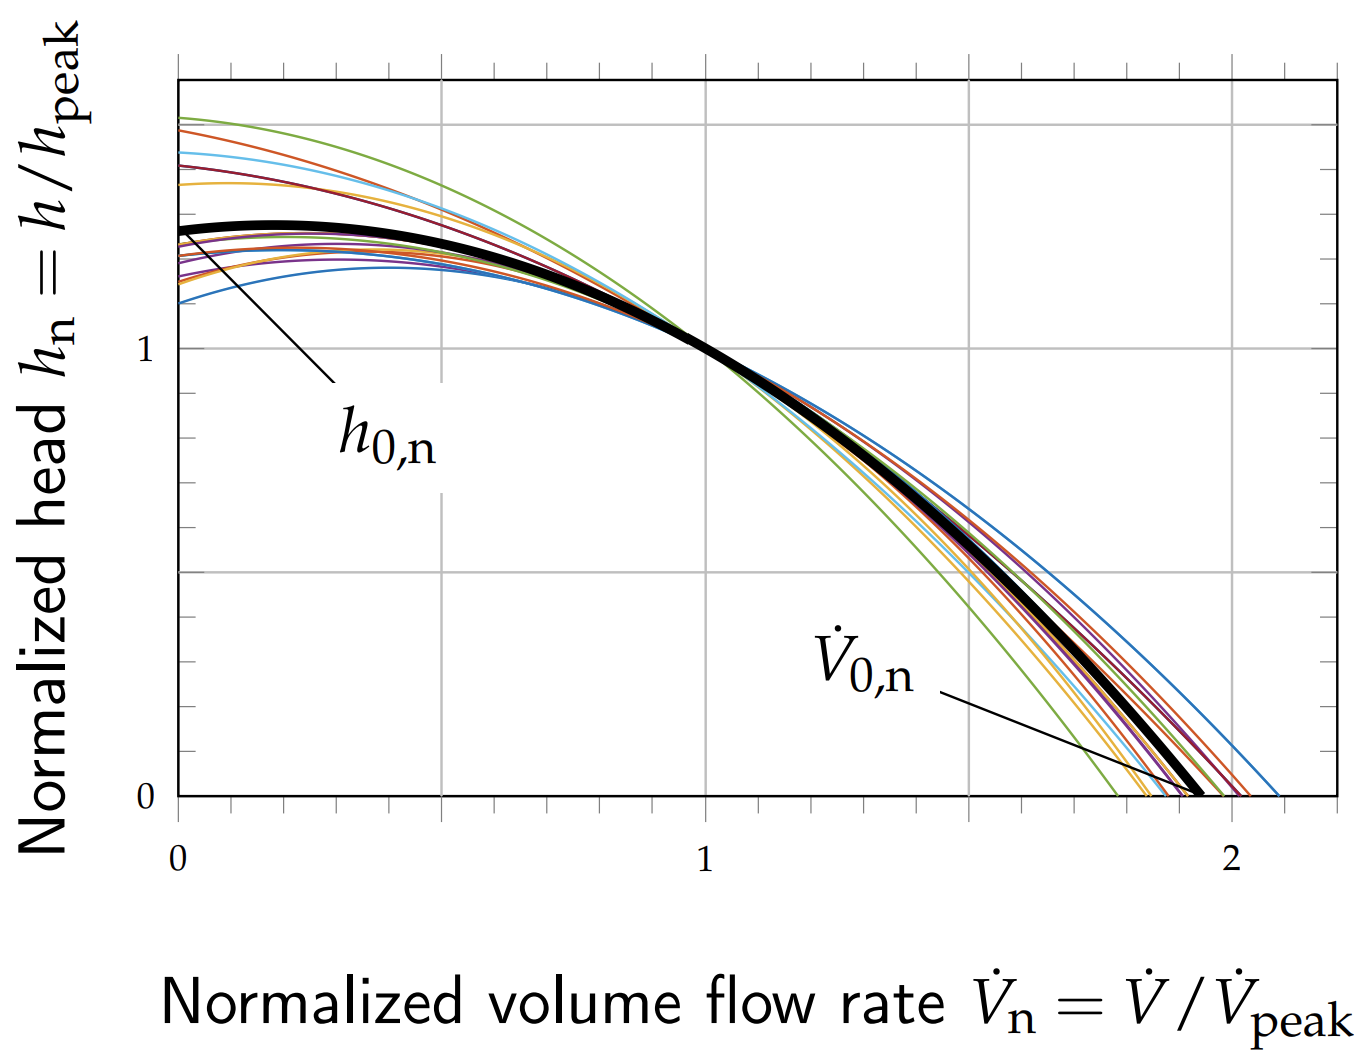
The following figures show the normalized head h_n =
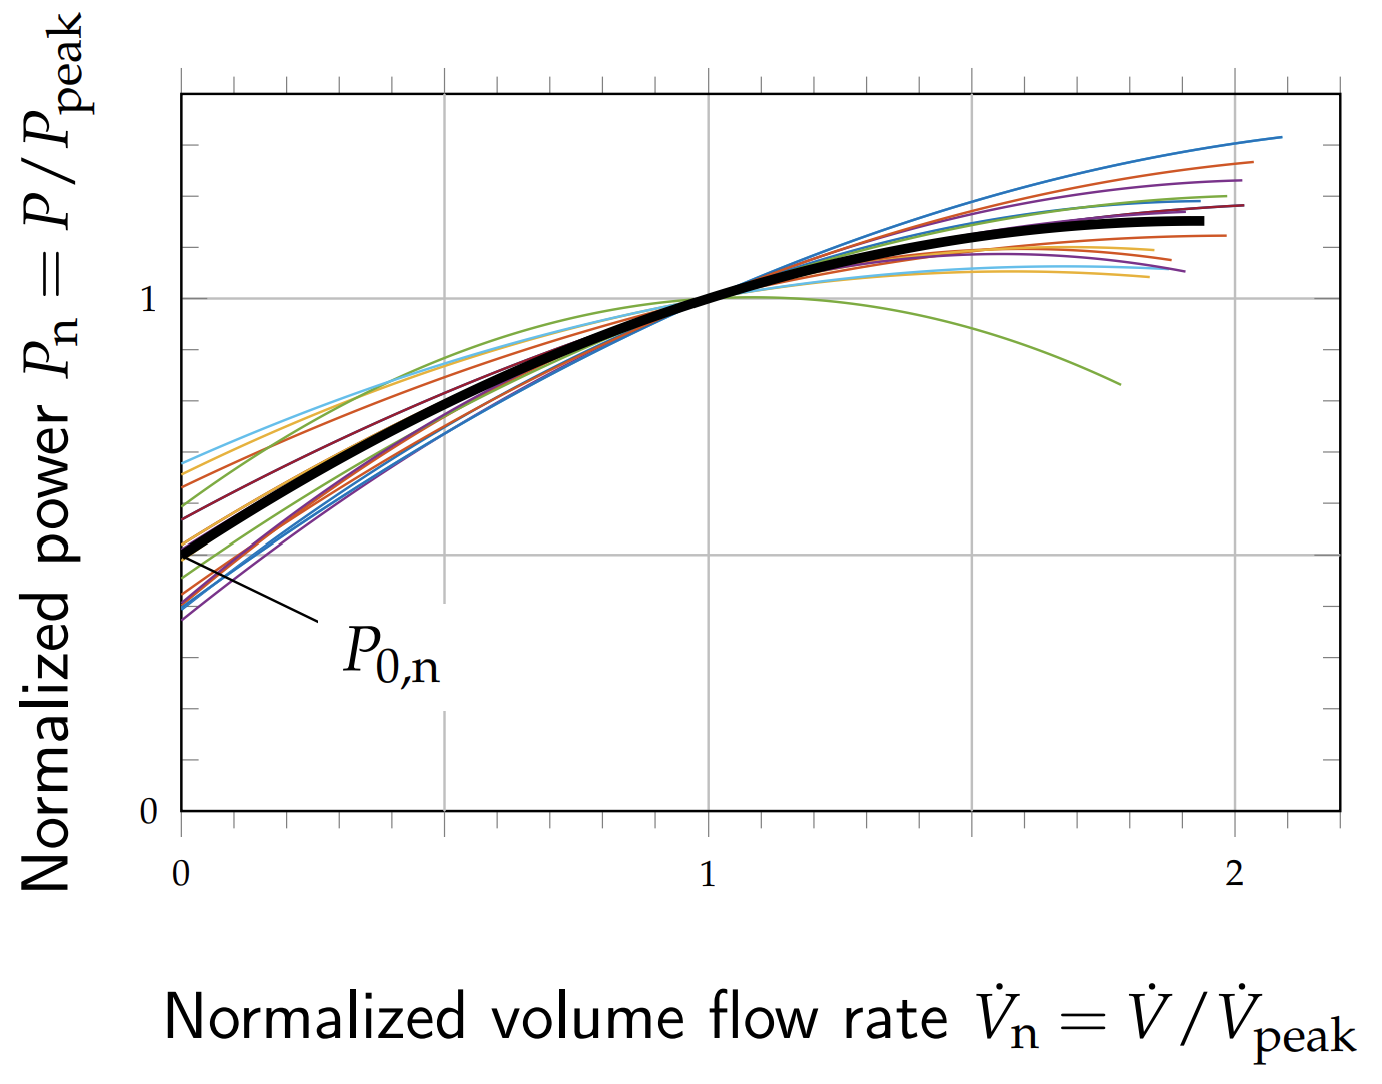
h/h_peak, the normalized power P_n = P/P_peak
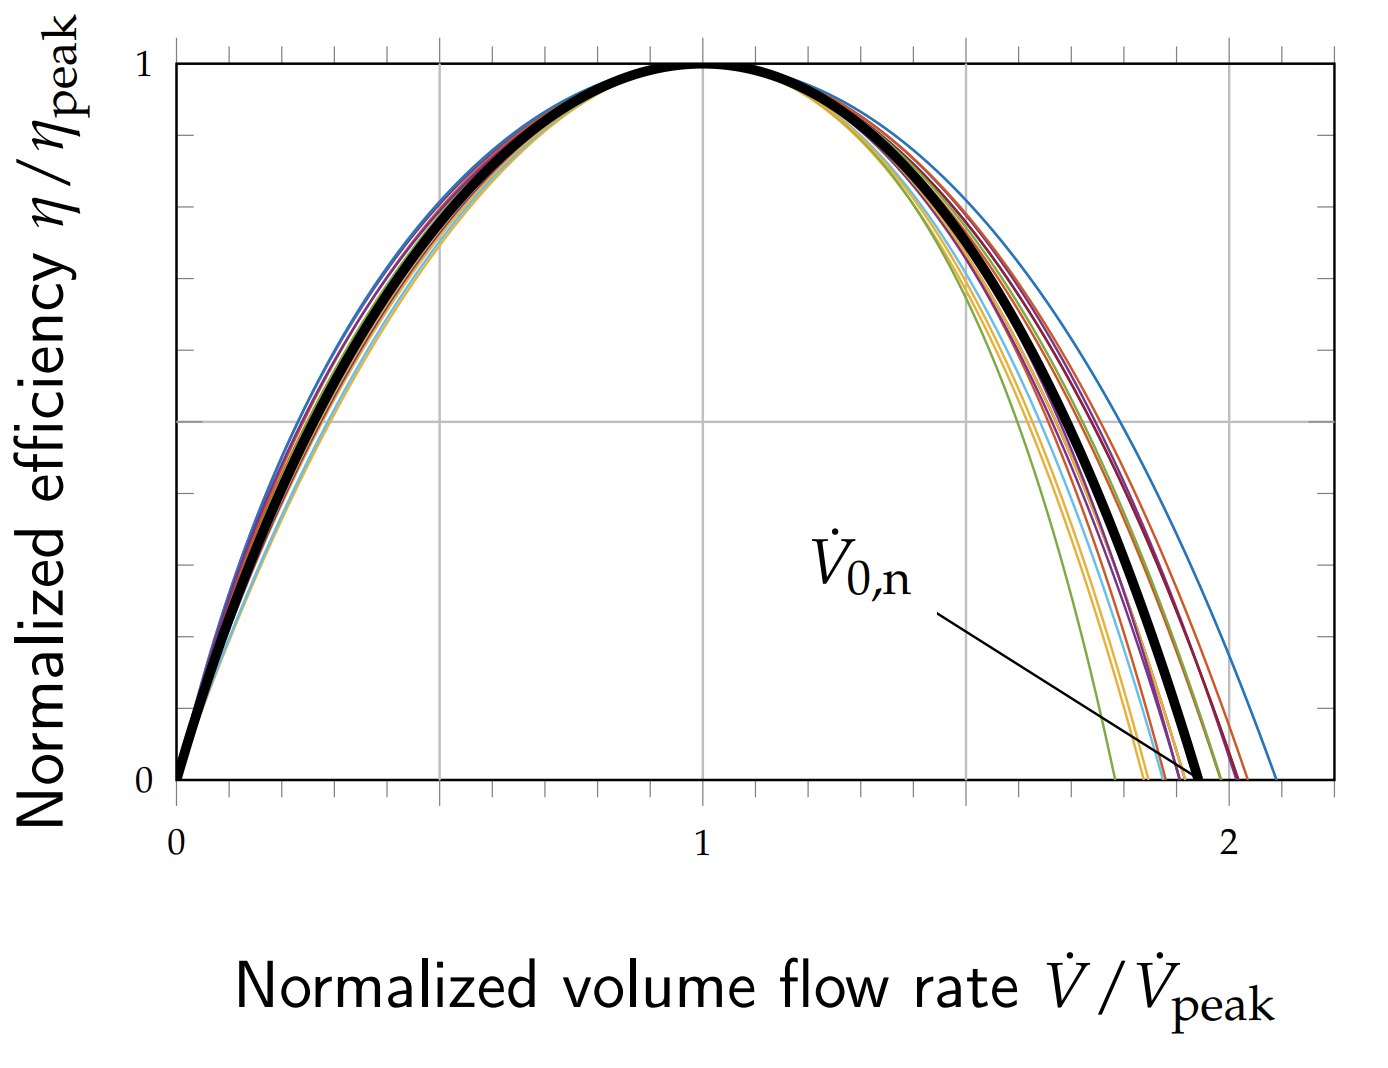
and the normalized efficiency eta/eta_peak at
reference speed w = w_ref in dependency of the
normalized volume flow rate V_flow_n =
V_flow/V_flow_peak.
Thereby h_peak, P_peak and
V_flow_peak are head, power and volume flow rate at
the peak efficiency eta_peak.
h_0n ≈ 1.273 ± 0.128, min 1.101, max 1.516 is the
normalized head at zero volume flow rateV_0n ≈ 1.946 ± 0.087, min 1.784, max 2.090 is the
normalized volume flow rate at zero headP_0n ≈ 0.499 ± 0.099, min 0.372, max 0.677 is the
normalized power at zero volume flow rateColors refer to different pumps. A mean centrifugal pump curve is displayed as think solid.